Now you can easily investigate changes in your data, moving from high-level observations to insights in the same conversation.
Ask a why question
Once you have asked a business question like, “What’s my monthly sales?” or have an existing visualization, you can now ask a natural question starting with “Why”. ASK BOSCO® AI Analyst uses change analysis to answer Why questions about a single metric on simple, non-sliced charts. Below are a few examples:

Identifies the revenue metric, picks up the date point to identify the key change drivers between that and the next date point.
Explain the change in website traffic last week compared to the week before.Compares the website traffic metric for this week versus the previous week.
-
Why question process
Here’s an example for asking why questions in ASK BOSCO® AI Analyst:
-
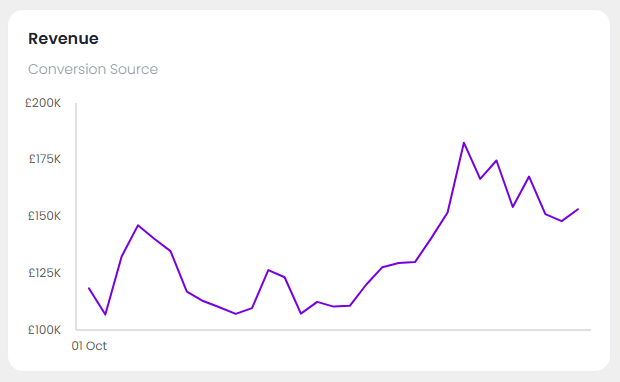
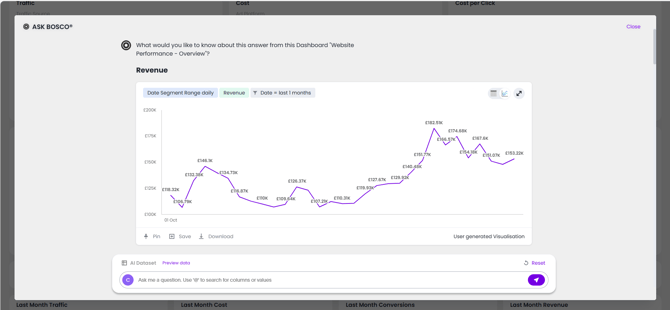
Start with a visualization: Begin with a chart in AI Analyst that shows a metric you’re interested in, such as your monthly sales. Or launch ASK BOSCO® AI Analyst from a visualization in a dashboard that has a metric.
-
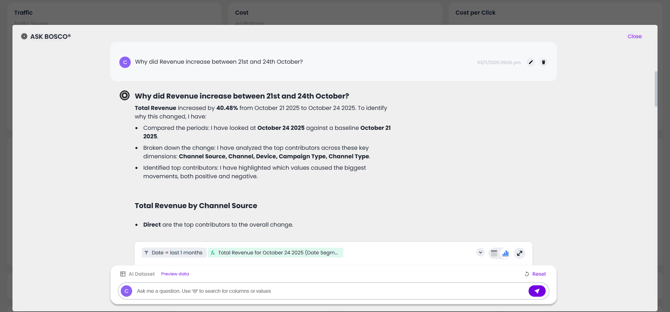
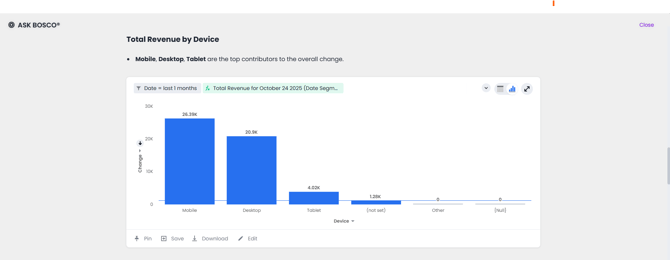
Ask why: When you notice a change, like a drop or a spike, simply ask a natural language question in the search bar. For example, after seeing a chart of monthly sales, you could ask, “Why did revenue increase 21st to 24th October?”
-
Review the analysis: ASK BOSCO® AI Analyst performs change analysis and presents the findings in a structured manner:
-
Analysis plan: AI Analyst first explains how it understands your question and which attributes it will analyze to find the answer.
-
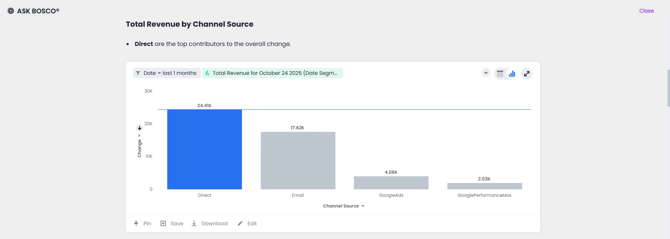
Detailed visualizations: AI Analyst then provides detailed change analysis charts that break down the contributions from different attributes, giving you the full evidence behind the findings.
-
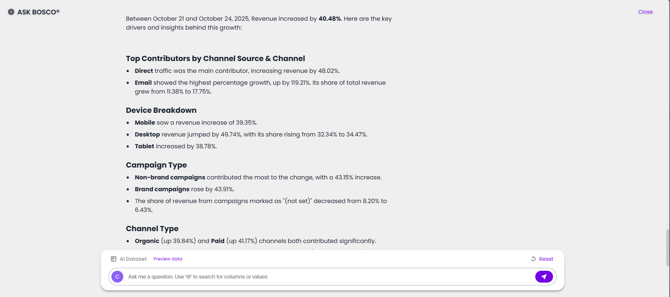
Narrative summary: Finally, ASK BOSCO® AI Analyst provides a concise, natural language summary of the key drivers so you can quickly understand the main takeaways.
-
-
-
Limitations
Why questions in ASK BOSCO® AI Analyst have the following limitations:
Chart typesThis feature works best on charts with a single measure, and no slicing by color or other attributes. It may not provide an answer for multi-line or complex stacked charts.
Ambiguous questionsIf your question is ambiguous (for example, you ask about “March” when multiple years of March data exist), AI Analyst returns an error and prompts for clarification. For ambiguous timeframes like “Why did sales drop?”, AI Analyst will default to comparing the last two data points and state this in its analysis.
Data granularityThis feature may not work as expected if the x-axis has a very high number of data points (for example, >1000).
Change analysisASK BOSCO® AI Analyst does not support change analysis for queries based on the
growth ofandversus(vs) keywords.Change analysis is not supported on certain complex formulas based upon group_* functions (such as
sum(group)orsum(x)/ group_*).Simple functions that only use
Personalized columnsgroup_*are supported.If you have set up personalized columns in a KPI chart, then ask a why question of the chart in ASK BOSCO® AI Analyst, AI Analyst chooses columns based on usage-based ranking to answer, rather than your selected columns.
 This article was prepared for you by Claire. November 2025.
If you have any questions please get in touch! team@askbosco.io