In this module we'll cover:
- Introduction
- Key Features
- Key Reports
- Website Performance Report
- Paid Media Reports
- SEO Reports
- Affiliate Report
- Knowledge Check
Introduction
Pre-built Reports provide instant access to important business insights without requiring complex setup. This guide will walk you through their key features, how to use filters and tabs effectively, and how to adjust date ranges for more accurate data analysis.
You can access all the reports which have been built by ASK BOSCO® from the Reports Templates section under Reporting. They will also show in the All Reports tab.
If you have a second screen, it may be helpful for you to open ASK BOSCO® and navigate to these reports, so that you can try things out, as you read through this article.

Key Features of the Pre-Built Reports
The general layout of the pre-built reports is as follows and pictured in the Website Performance - Overview, as an example:
- Interactive filters and parameters
- Tabs show different areas of focus
- Summary of headline metrics & KPIs
- Detailed pivot tables of all the main metrics and KPIs
- Line graphs showing the progression of different metrics and KPIs over time

Tabs
Tabs like Marketing Channel and Platform Discrepancy provide different perspectives, enabling users to compare key aspects of their operations with ease. Effectively utilizing tabs ensures a more structured and in-depth approach to analyzing performance data.
Within the specific Paid Media reports (e.g. Paid Search, Paid Social and Affiliates), there is a tab that provides a breakdown by campaign or publisher, enabling a more in-depth analysis of performance.
Filters & Parameters

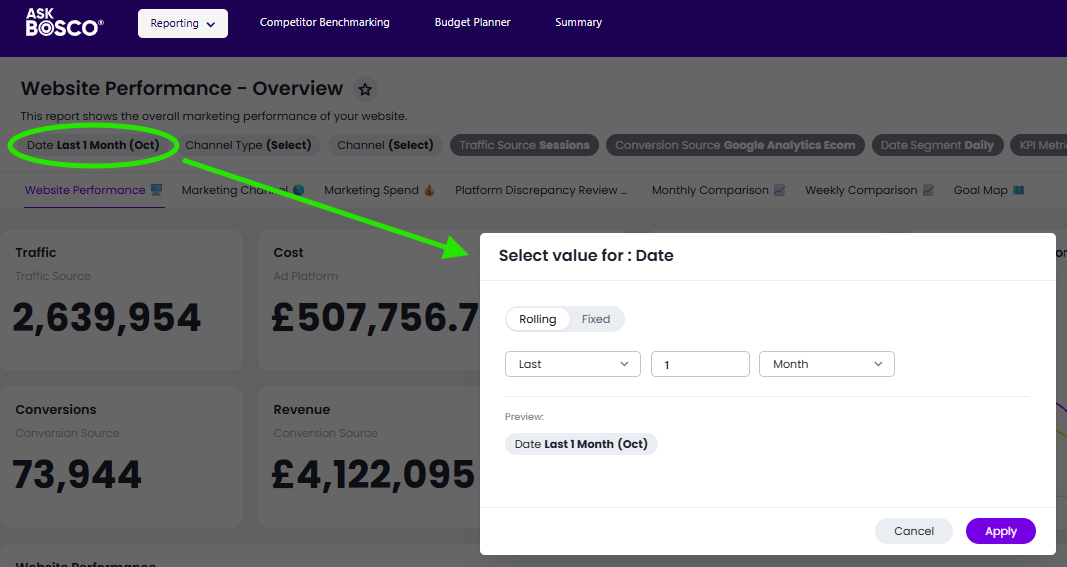
To refine data analysis, users can apply filters (see top of each report for the light and dark grey measures and attributes) such as:
- Date:
- Select 'Rolling' and then choose from yesterday, last X days, weeks or months.
- Select 'Fixed' and use the drop downs to either select a time period or a specific day.
- Channel:
- In Paid Search reports, you'll be able to switch between PPC, Shopping and Performance Max.
- In the Website Overview report, you can choose any channel(s).
- Channel Type:
- Use this in the Website Overview report to compare paid channels vs. organic channels.
- Traffic source
- Select clicks to pull traffic metrics from ad platforms
- Select sessions to pull traffic metrics from GA4.
Conversion source
-
- Choose either ad platform or GA4 Ecom, GA4 other goals

- Choose either ad platform or GA4 Ecom, GA4 other goals
Note: The numbered goals will be define in the Goal Map tab in the dashboard.
- Date Segment
- View your data either Daily, Weekly or Monthly.
- Source
- Use this to filter by platform, for example, Google or Bing, Meta or LinkedIn etc.
These filters & parameters allow for a more detailed breakdown of large datasets, making it easier to uncover actionable insights.
Headline Metrics
Summarizing the main metrics for your data these will change, live in the dashboard, as you select which filtered view you want to see.

Graphs
Choosing the right type of data visualizations and crafting a compelling narrative to make your intended message resonate with the stakeholders is so important.
These reports mostly utilize line graphs to show the progress/trend over time.
There are currently over 20 visualizations you can use in ASK BOSCO® to show data trends and we will cover the main ones later in the course.

Pivot Tables
Pivot tables enable you to explore your data in a wide, customizable table. They allow you to visualize the data horizontally and vertically in the same table.

Pivot tables use a drag-and-drop interface for flexible changes to the way the data is displayed. Hover over any heading on the left hand side in this table and you can drag it left or right to rebuild the table with the layout you want.
We will talk more about working with Pivot tables later in the course.
Key Reports
Website Performance Report
The Website Performance dashboard provides a comprehensive overview of marketing effectiveness by tracking essential KPIs such as traffic, costs, conversions, revenue, and return on ad spend (ROAS). Users can apply filters—including date range, channel type, and traffic source—to analyze specific performance metrics.

At a glance, the top section displays key metrics, enabling marketers to assess overall trends quickly.
A Revenue vs. Conversion Rate graph highlights performance fluctuations over time, helping identify emerging patterns.

Below, the Website Performance table offers a detailed breakdown of impressions, click-through rate (CTR), cost per click (CPC), and revenue by date and channel.
For deeper insights, additional tabs such as Marketing Channel and Platform Discrepancy Review provide alternative perspectives, ensuring a thorough and data-driven approach to marketing optimization.
You can visit this link to view the following demo of the report in another screen, or walkthrough below.
Paid Media Reports
The Paid Reports dashboard delivers an in-depth analysis of paid media performance, tracking metrics such as traffic, costs, conversions, revenue, conversion rate, and ROAS. Users can refine the data using filters for date range, channel, campaign, and traffic source to gain more precise insights.

The top section provides a performance summary, while the Revenue vs. Cost Comparison graph visually illustrates expenditure trends and returns. Below, the Paid Performance table offers a detailed breakdown of impressions, CTR, CPC, and revenue across various channels and sources.

For further analysis, additional reporting tabs like Paid Search Channel and Monthly Comparison present segmented views, allowing marketers to optimize paid media strategies with greater accuracy.
(Demo coming soon)
SEO Reports
The SEO dashboard provides a comprehensive analysis of organic search performance, tracking key metrics such as traffic, conversions, organic revenue, and click-through rate (CTR). Users can filter the data by date range, page, Conversion Metric and KPI metric to gain deeper insights into specific SEO efforts.

The top section offers an overview of overall SEO performance, while the Monthly SEO Performance table breaks down impressions, sessions, clicks, AOV, CTR and conversion rate.

For further analysis, additional tabs like GSC Page Review and Monthly SEO Comparison allow for detailed segmentation, enabling marketers to refine their SEO strategies for better search engine visibility and improved performance
You can visit this link to view the following demo of the report in another screen, or walkthrough below.
Affiliate Reports
The Affiliates - Overview dashboard offers valuable insights into affiliate marketing performance by tracking key indicators such as sessions, cost, conversions, revenue, conversion rate, and ROAS. Users can refine their analysis with filters for date range, channel, source, and publisher to evaluate specific affiliate partnerships.

The top section presents a concise summary of performance data, while the Revenue vs. Cost Comparison graph visually represents spending efficiency over time. The Paid Affiliate Performance table provides a granular breakdown of impressions, CTR, CPC, and revenue, helping businesses assess the effectiveness of different affiliate sources.

To further segment and analyze data, additional tabs like Affiliate Channel and Affiliate Publisher offer alternative perspectives, enabling a data-driven approach to optimizing affiliate strategies.
(Demo coming soon)
Copying a template to make edits
To copy and customize a report template, simply find the template you want to use, and click the 3 dots in the top left corner of the report, then click 'Make a copy'

You can then edit your dashboard and name it whatever you want and add a description, then click save.

You will then be able to find your report under the 'My Reports Tab'

Once you’ve made a copy, you can easily edit it to suit your needs—whether that means adjusting sections, changing data points, or rebranding the template.
After making your changes, save the new version and you’re ready to use it for your reports. This way, you can keep the structure of the template while making it your own.