Accessing the Styling Panel
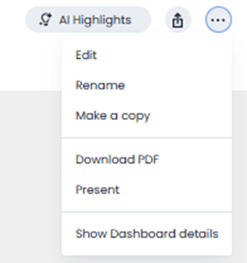
- To begin, open the Dashboard you wish to edit. Navigate to the More menu in the top right corner.
- From the More menu (top right ), select Edit.
- If this option is greyed out, you do not have edit privileges. Please contact your administrator or the Dashboard creator.
- If this option is greyed out, you do not have edit privileges. Please contact your administrator or the Dashboard creator.
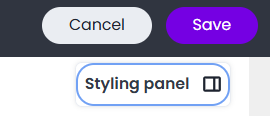
- Once in edit mode, the “Styling Panel” will become visible. Click on it to open and adjust styling options for your Dashboard.
Style parts of the Dashboard
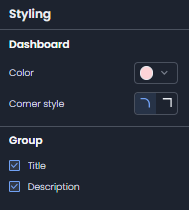
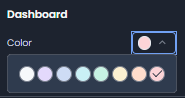
Choose a theme colour for the Dashboard. For each Dashboard, you can select a theme colour from a set of preset options. When chosen, the theme colour is automatically applied to the Dashboard background, as well as the backgrounds of groups and Visualization or Note tiles.
Choose a corner style for the Dashboard. Select either curved or sharp edges. The corner style changes the border radius of every Visualization, Note, or Group within the Dashboard.
![]()
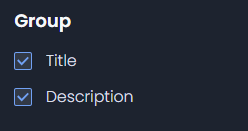
Hide or display titles and descriptions for all groups. You can choose to show or hide the title and description for every group in a Dashboard.
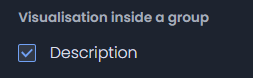
Hide descriptions for Visualizations / Answers inside groups. For all Visualizations contained within groups on the Dashboard, you can choose to hide their descriptions.
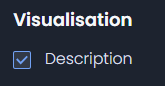
Hide descriptions for standalone Visualizations / Answers. For all Visualizations not contained in a group, you can choose to hide their descriptions.
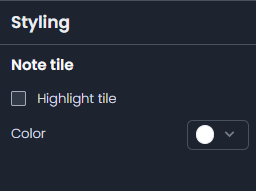
To customize individual elements of your Dashboard, such as Notes, simply click on the item. The Styling Panel will open, showing all available styling options.
Grouping
The Dashboard Grouping feature allows you to organise multiple Visualizations and Notes into cohesive groups, ensuring your dashboards remain structured and easy to navigate.
Create a New Group
To create a new group:
- Open the Dashboard you would like to edit.
- From the More menu (top right ), select Edit.
- If this option is greyed out, you do not have edit privileges. Please contact your administrator or the Dashboard creator.
- If this option is greyed out, you do not have edit privileges. Please contact your administrator or the Dashboard creator.
- Hold Shift and select the Visualizations and Notes you wish to group together.
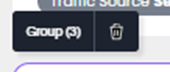
- Once selected, the Group option will appear in the toolbar of the final tile selected.
- Click Group to create your new group.
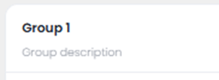
- You can now add a Title and Description to the group.
Add a Visualization or Note to a Group
- From the left-hand menu, select Dashboards.
- Open the Dashboard you would like to edit.
- From the More menu (top right), select Edit.
- Select the Visualization or Note you want to add to a group.
- Click the Move icon, then choose Move to Group.
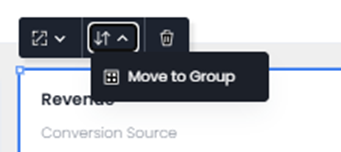
- Select the group you wish to add it to it will appear in the bottom left of the group.
Remove a Visualization or Note from a Group
- From the left-hand menu, select Dashboards.
- Open the Dashboard you would like to edit.
- From the More menu (top right), select Edit.
- Select the Visualization or Note you wish to remove.
- Click the Move icon, then choose Move out of Group.
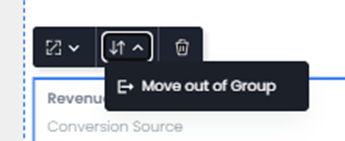
- The selected tile will now appear outside the group.
Resize and Move Visualizations or Notes within a Group
- The width of any Answer or Note can be adjusted to match the width of the group.
- The height can be increased beyond the group’s size the group will automatically expand.
- Visualizations and Notes can be freely moved within the group. If a tile is moved below the group’s height, the group will expand automatically.
Resize or Move a Group
- Groups can be moved anywhere within a Dashboard, including to another tab.
- You can resize groups horizontally or vertically contained Visualizations and Notes will adjust automatically.