Change the view
You can change the view of your Visualization so it appears as either a table or a chart.
To change the view of your Visualization:
- View your Visualization.
- Toggle between either a table or a chart type.

When you display your data as a chart, ASK BOSCO® automatically selects the type of chart that works best for your data. If you want to use another type, click the Change visualization icon

and select the type of chart you want.
Sort your search
Sorting your search allows you to order your Visualization, making it easier to read. To sort your search:
- If you are in the data (table) view, select the column header you would like to sort on.
By default, sorting applies in descending order. For example, if the column has numerical values, it would start at the highest number and decrease. Select the column header again to sort in ascending order.
Hold shift and select another column to add a secondary sort. You can even add tertiary sorting and so on by continuing to use this trick.
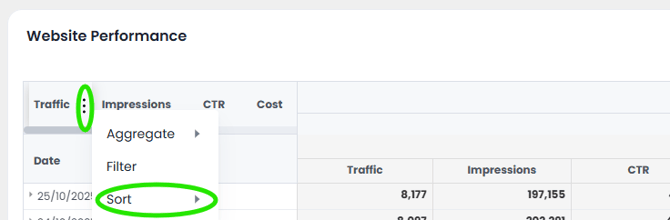
- If you are in a Pivot Table view then click the three dots next to the column title and select Sort
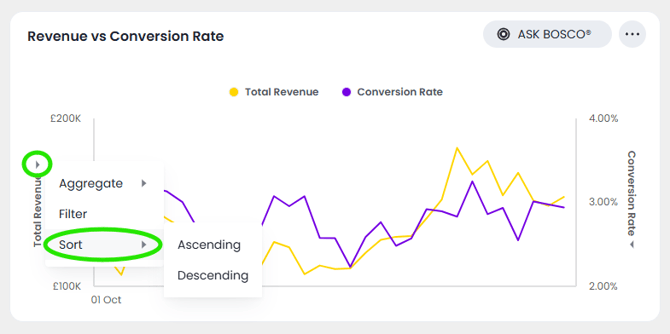
- If you are in the chart view, click the axis label of your chart that you would like to sort and select Sort. You can choose to sort in ascending or descending order.
Hidden sort
You can also sort by a measure that you do not want to include in the chart. For example, if you add search tokens for Campaign and sort by AOV, you can move AOV to the "Not visualized" section from the Edit chart panel.
ASK BOSCO® sorts the chart by AOV, but AOV does not appear in the chart. This is also known as a hidden sort.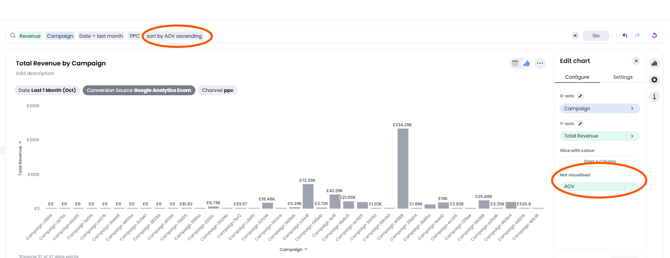
You cannot perform a hidden sort on an attribute or date column.
Custom sort
You can sort on specified attributes in a chart, using custom sort.
- Go to the Sort option on the attribute axis and sort in ascending or descending order.
- In Edit chart on the right, click the attribute axis, click Edit Column Properties
- Under Sort order, select either Alphanumeric or Custom sort.
Change the date bucketing (grouping)
You can change the date bucketing on tables and charts for columns with date values. Bucketing is a method for grouping a column in your data. To bucket your data in a table view, click the three dots (More) icon that appears when you hover over a column name on a table.
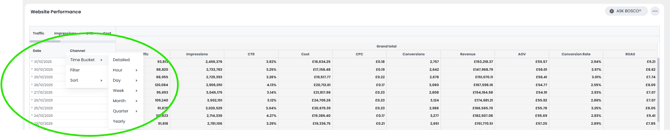
You can specify date bucketing at many granularities, from detailed (to the minute or second) to yearly, depending on your data. You can also specify bucketing based on the position of a bucket relative to another, larger bucket. For example, you can group data by month of quarter, or week of month.
To bucket your data in a chart view, open the dropdown icon that appears when you hover near the axis labels on a chart.
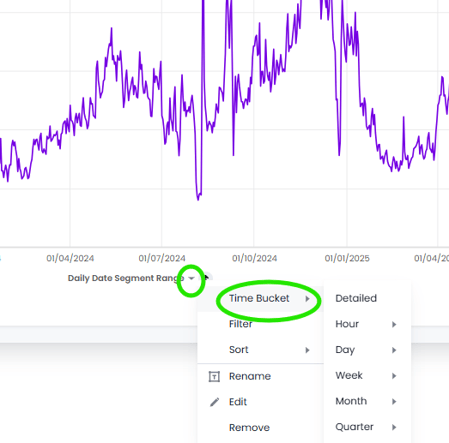
ASK BOSCO® chooses a default date bucket for you when you create a chart. This default takes the entire search result into account. For example, if your search includes last month, dates are bucketed daily instead of monthly.
When you add multiple date keywords to a Search, ASK BOSCO® preserves the date bucketing implied by the first date keyword. If you search for revenue monthly yearly, you see the results using the monthly date bucketing, and the results look like the following:
|
Monthly order date |
Yearly order date |
Total revenue |
|
Jan 2025 |
2025 |
£102,516 |
|
Feb 2025 |
2025 |
£106,423 |
If you would like to change the date bucketing to be month of year instead, you can do so by hovering over the Monthly order date column title, clicking the more options icon , and selecting Time Bucket > Month > Month of Year.
Exclude and include row values
You can include or exclude row values from your Visualization.
To exclude or include row values:
- In Edit mode, right-click the visualization or table cell of interest.
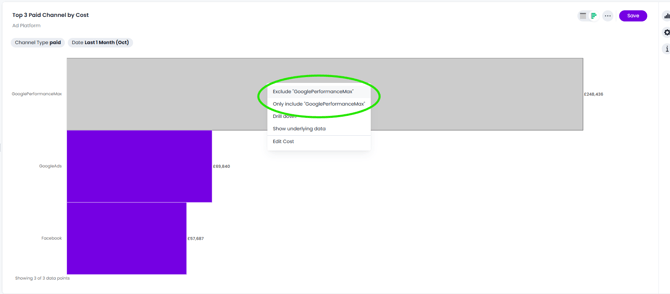
- Select Exclude "value" or Only Include "value" if available.
Undo, redo, and reset buttons
As you work with searches and Visualizations, you may want to undo or redo an action.
Use the in-product undo, redo, and reset buttons to reset or go back or forward 1 step each time you make a change in a Visualization (for example, when you add a new column to the search, drill down, or sort).

These buttons appear to the right of the search bar in a search or saved Visualization. Note that the reset button is only available for saved Visualizations; it resets the Visualization to its last saved state.
 This article was prepared by Claire. If you have any questions please email team@askbosco.io
November 2025