.png?width=260&height=102&name=ASKBOSCO_Logo_Grey_RGB%20(6).png)
What's changed
Previously, the homepage only displayed Shopify metrics (Net Sales, Orders, AOV), with a channel mix chart as the sole cross-channel element. Now, your dashboard pulls together data from Shopify, GA4, and your connected marketing platforms, so you can see how your marketing activity is driving your ecommerce performance without leaving the page.
The dashboard is designed to stay useful no matter which data sources you've connected. Every component now clearly shows whether it's Locked, Syncing, or Live, so you always know what's available, what's still on its way, and what you still need to connect.
What you'll see
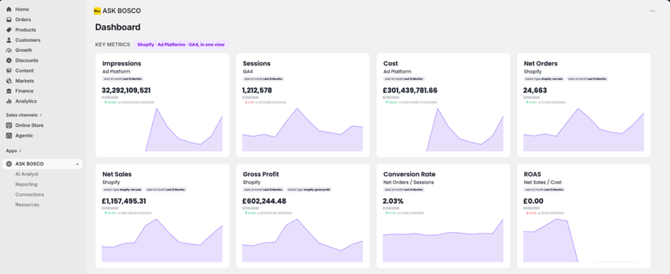
An expanded KPI dashboard
Your homepage now shows eight KPIs in one view:
- Impressions
- Sessions
- Cost
- Net Orders
- Net Sales
- Gross Profit
- Conversion Rate
- ROAS
New cross-channel charts
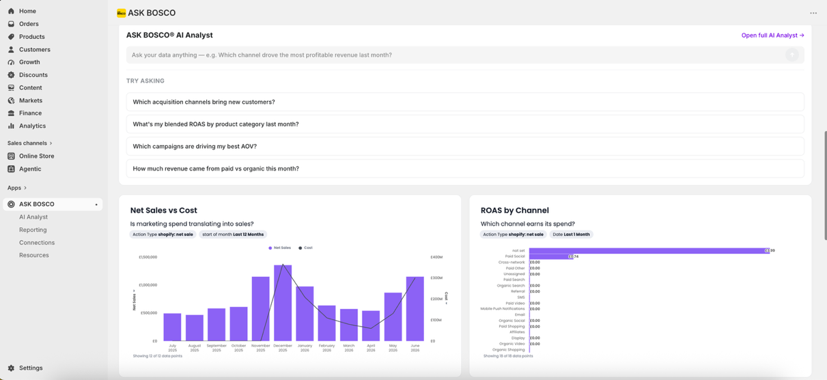
Four charts bring your Shopify and marketing data together to tell the cross-channel story:
- Channel Mix – Net Sales (Shopify) mapped to your GA4 session channel group, showing where your revenue is coming from
- New vs Returning Customers – Shopify customer segmentation shown alongside Net Sales and AOV by segment
- Net Sales vs Cost – your marketing spend plotted against Shopify revenue over time
- ROAS by Channel – return on ad spend broken down by advertising channel
Locked, Syncing, and Live states
Every component on your homepage now clearly communicates its data availability:
- Locked – the data source this component needs isn't connected yet. You'll see what's required and a direct link through to the Connections tab.
- Syncing – you've just connected the data source, but the data hasn't arrived yet. A loading indicator lets you know this can take a few hours.
- Live – your data is available and the component is showing live figures.
Components move between these states automatically as your data becomes available, so there's nothing extra you need to do.
AI Analyst suggested prompts
Your homepage now includes example AI Analyst prompts to help you get started with data-driven questions, such as:
- "Which acquisition channels bring new customers?"
- "What's my blended ROAS by product category last month?"
Selecting a prompt submits it straight away, opening the AI Analyst tab and starting your chat.
Good to know
- KPI cards and charts on the homepage are fixed, they don't currently support drilling down, change analysis, or filtering.
- The KPI cards, charts, and AI Analyst prompts are the same for everyone and can't be customized by the user.
Who this helps
Ecommerce and trading managers can see performance across ecommerce and marketing at a glance, without navigating to separate reports, and understand immediately whether marketing spend is driving revenue and which channels are contributing most.
C-level and senior stakeholders get a top-line, cross-channel view without relying on a team to prepare it, giving an immediate sense of the value in combining data sources that would otherwise need multiple tools.
Merchants new to ASK BOSCO® are guided through what to connect next via the Locked and Syncing states, rather than being left looking at empty or broken-looking components. Suggested AI Analyst prompts also make it easier to start exploring data if you're not sure what to ask first.
This article was created by Grace. If you have any questions or need a hand, feel free to reach out to us at team@askbosco.io

Aug 26